Thursday, 12 March 2015

Sort students into groups using Quadratic Representations

In this activity students are each given one card. The card will either have a graph, table of values or equation of a quadratic relation. Their job is to find the two other students who have the other two representations of the same quadratic relationship. This shouldn't take too long and could be repeated every couple of days to solidify conversion between representations.
New: Alternatively, you could have students just work individually on this Desmos card sort 


  • MPM2D - A3.3 determine, through investigation, and describe the connection between the factors of a quadratic expression and the x-intercepts (i.e., the zeros) of the graph of the corresponding quadratic relation, expressed in the form y = a(x – r)(x – s);
  • MBF3C - A1.8 determine, through investigation, and describe the connection between the factors of a quadratic expression and the x-intercepts of the graph of the corresponding quadratic relation
  • MCF3M - A1.5 determine, through investigation, and describe the connection between the factors used in solving a quadratic equation and the x-intercepts of the graph of the corresponding quadratic relation
  • MCR3U - As review
  • Download the cards and cut them out (you may want to laminate them)
  • If you are doing the Desmos Cardsort instead, students should have devices to do the sort on (note that phones have screens that are too small)
  1. Shuffle the cards and distribute one per student. Note that there are 11 sets of 3 cards so you may want to remove sets to more closely match your student population.
  2. Instruct students to find the two other people that have different representations for the same quadratic relation. 
  3. Once students find their partners they will be in groups of three
If doing the Desmos Cardsort instead, have students (or pairs of students) complete each page of the cardsort. You may wish to consolidate on the last page of the card sort.
Did you use this activity? Do you have a way to make it better? If so tell us in the comment section. Thanks

Wednesday, 28 January 2015

Geometer's Sketchpad - Practice the Pythagorean Theorem

When using the Geometer's Sketchpad it is often better to "start from sketch, not from scratch". That is, give students a premade sketch rather having them build something from nothing (as many textbooks would have you do). 
In this activity students can download a GSP sketch that allows them to practice determining the hypotenuse (on the first page) or a leg (on the second page). The sketch will generate an infinite number of questions and give a full solution for each.
Note: Although Pythagorean Theorem is introduced in grade 8, it is only supposed to be relating more to the area model so these practice problems may not fit that. 


  • MPM1D, MFM1P: D, C2.2 - solve problems using the Pythagorean theorem, as required in applications
  • MPM2D, MFM2P: C,A2.2 - determine the measures of the sides and angles in right triangles, using the primary trigonometric ratios and the Pythagorean theorem;  
  • All that is needed are the electronic downloads (below)
  • Note that this really works well on an iPad using the Sketchpad Explorer App (which is free)
  • You can also use this on any web based computer (or Chromebook) with this Web sketch
Watch the video below to see how to use the sketch. The first page can be used for determining the hypotenuse and the second page can be used for determining a leg. Both will randomly generate an infinite number of problems.


Did you use this activity? Do you have a way to make it better? If so tell us in the comment section. Thanks

Geometer's Sketchpad - Practice Midpoint of a Line Segment

When using the Geometer's Sketchpad it is often better to "start from sketch, not from scratch". That is, give students a premade sketch rather having them build something from nothing (as many textbooks would have you do). 
In this activity students can download a GSP sketch that allows them to practice determining the midpoint of a line segment on the first page (this part could also be used to check answers) and then to be quizzed with randomly generated sets of points on the second page.


  • MPM2D: B2.1 - develop the formula for the midpoint of a line segment, and use this formula to solve problems
  • All that is needed are the electronic downloads (below)
  • Note that this really works well on an iPad using the Sketchpad Explorer App (which is free)
  • You can also use this on any web based computer (or Chromebook) with this Web sketch
Watch the video below to see how to use the sketch. The first page can be used for discovery or for checking problems and the second page can be used for quizzing students as it will generate an infinite number of random segments to find the midpoint of.

Did you use this activity? Do you have a way to make it better? If so tell us in the comment section. Thanks

Thursday, 8 January 2015

Geometry Board Game


This is a geometry review activity where students will find missing angles formed by lines, in triangles and in polygons. The game is loosely based on the Candyland board game where students move pieces around a board and answer questions based on the colour they land on.


  • MPM1D, MFM1P - determine, through investigation using a variety of tools (e.g., dynamic geometry software, concrete materials), and describe the properties and relationships of the interior and exterior angles of triangles, quadrilaterals, and other polygons, and apply the results to problems involving the angles of polygons
  • MFM1P - determine, through investigation using a variety of tools (e.g., dynamic geometry software, concrete materials), and describe the properties and relationships of the angles formed by parallel lines cut by a transversal, and apply the results to problems involving parallel lines

For each group (groups of two or four - playing against each other or in teams of two)

  • up to four game pieces 
  • one die
  • one game board printed in colour on card stock (laminated if possible). If you wish, one group can play on the Smartboard.
  • one instruction sheet printed on card stock (laminated if possible) with answer sheet on the back (preferably printed in colour)
  • one set of question cards. Each set consists of five types of questions that are colour coded. Print each on colour card stock (there is one page with 8-10 questions for each colour) and laminate (if possible) then cut them out. The colour of the cards loosely group the types of questions to supplementary, complementary, opposite angles (yellow), angles in triangles (blue), parallel lines (red), angles in polygons (green), more challenging questions that may require algebra (white). 

Game Setup
  1. Separate the cards by colour. Shuffle each colour and make a face down pile for each.
  2. Decide on teams (or play individually) and place a marker on START for your team.
  3. Keep the answer card face down at all times until checking your answers. 
Game Play
  1. Each team takes turns rolling the die and moving your markers.
  2. When you land on a colour, choose the appropriate card and answer the question (determine the values of the unknown variables). You have up to 2 minutes to answer your question.
  3. A player from the opposing team uses the answer key to quickly check your answer. If you do not answer your question correctly, move back to your last position.  Remember: the answer sheet must remain face down at all times except for checking solutions.
  4. If you land on a Mystery spot (marked with a ?) you will have 3 minutes to answer (since these are tougher questions). If you answer correctly, you get a free die roll and move to the appropriate spot without having to answer another question. If you answer incorrectly move back to your last position as before.
Ending the game
  1. To win the game, you must land exactly on the “You Win!” spot.
  2. Once there, the opposing team will choose a question (but not a Mystery question) from one of the piles (without looking).
  3. If you answer correctly, you win. If you answer incorrectly, move back to your last spot. 

The video, below, is only visible in the WECDSB domain. That is, only teachers in our school board can see the video if they are logged into their MyTools2Go accounts.


Did you use this activity? Do you have a way to make it better? If so tell us in the comment section. Thanks


Wednesday, 7 January 2015

Volume of a Pyramid

In grade 9 we are supposed to develop the formula for the volume of a pyramid via investigation. That is, by doing some sort of procedure (not algebraically). If you are lucky your schools might have a set (or several sets) of these volumetric solids so you can pour liquids from one to another to compare but if not, here is a cheap way to do the same thing (at least for right prisms). For an idea of how to do it via water and the volumetric solids, check out this post from Tap Into Teen Minds.

  • MPM1D, MFM1P - develop, through investigation (e.g., using concrete materials), the formulas for the volume of a pyramid, a cone, and a sphere (e.g., use three-dimensional figures to show that the volume of a pyramid [or cone] is 1/3 the volume of a prism [or cylinder] with the same base and height, and therefore that Vpyramid= Vprism/3

  • Each student or group needs six of the large nets to make their rectangular prism and three of the small nets to make the cube. See below to download the nets.
  • Note that each of these shapes is a pyramid, just non symmetrical.


Note that these instructions are for students. You may just wish to do this as a demo.

  1. Have the students construct the nine shapes using the nets (6 large and 3 small). 
  2. Taking the six large shapes, construct three symmetrical pyramids. Note the dimensions (size of base and height).
  3. Using the same six shapes, create a rectangular prism. Note the dimensions (size of base and height).
  4. How do the height and base of the prism compare to the one of the symmetrical pyramids? 
  5. How do the volumes of each pyramid compare to that of the prism?
  6. Taking the three small shapes, note the type of solid and its dimensions (size of base and height)
  7. Using the same three shapes construct a cube. Note the dimensions (size of base and height)
  8. How do the height and base of the cube compare to each non symmetrical pyramid? 
  9. How do the volumes of each non symmetrical pyramid compare to that of the cube?
  10. If you had any prism and a pyramid with the same base and height, how would the volume of the pyramid compare to the prism?
As an added feature you may wish to construct a figure that folds in and out from one shape to several shapes as seen in the videos below.

Did you use this activity? Do you have a way to make it better? If so tell us in the comment section. Thanks

Friday, 19 December 2014

The Area Representation of Pythagorean Theorem

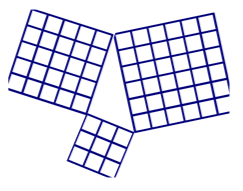
In Grade 8 here in Ontario, Pythagorean Theorem is introduced for the first time. It is pretty common for students to only see a2 + b2 = c2 and they move on. This can be a problem for students since if they only see that formula, they can't get past the a's, b's & c's and often get them mixed up because they don't understand them (so many kids can recite a2 + b2 = c2 proudly but that's where their expertise stops). But if you examine the expectations, you will see that really the focus is on the conceptual nature of the relationship. So we developed this activity to focus on the area representation of PT. The premiss is that students are given six sets of three numbers. The numbers come in the form of the side lengths of squares. Three of the sets are Pythagorean Triples the others are not (students are not told this). They then use the given squares to construct triangles (using the squares as the side lengths) and (hopefully) discover that right angled triangles have a special relationship with the areas of the squares.
A NEW ADDITION is an Explain Everything version. In this version students manipulate the squares right in the app.

  • Gr8NS1.4 - determine the Pythagorean relationship, through investigation using a variety of tools (e.g., dynamic geometry software; paper and scissors; geoboard) and strategies; 
  • MPM1D, MFM1P - relate the geometric representation of the Pythagorean theorem and the algebraic representation a2 + b2 = c2 ;
  • Print (on card stock preferably), laminate (optional) and cut out the squares. Note that the squares should be cut out as tightly to the edge as possible. Each group of 6 should have one set of cards. 
  • Each group should have 1-2 pieces of chart paper
  • Markers 
  • whiteboards (optional)

  1. Place students in groups of six (or in any group size that could be split in two).  Three students will construct triangles using squares with the following side lengths:     1) 5, 10, 12     2)  9, 10, 17   3) 12, 13, 15  (this group will create non right angled triangles - don't tell them this). The other three students will construct triangles using squares with side lengths:  4) 5, 12, 13   5) 6, 8, 10      6) 8, 15, 17 (this group will create right angled triangles - don't tell them this). Regardless, each set of students should trace the triangles and the squares that form them on their own chart paper (if they don't trace them, they won't have enough squares).
  2. Ask the group of six if they notice anything different between triangles in groups 1, 2, 3 compared to groups 4, 5, 6 (hopefully they they will notice that in one set the triangles are right)
  3. Ask students to find the area of each square and see if they can find any relationship in the squares in each of groups 4, 5 & 6 compared to groups 1, 2 & 3 ( you may need to steer some groups towards the sum of the areas with gentile questioning)
  4. Discuss, as a group, what they discovered.
  5. Give students a whiteboard and ask them to find the missing sides in triangles. A Smartboard file is attached with several more triangles.
  6. As an extension students can investigate how general the area relationship is using this WebSketch.
Note: if using the Explain Everything version, all six groups are on the same file. So depending on how many iPads you have, you may group students differently. 


  • Square Templates (pdf) (doc)
  • Explain Everything (xpl)
  • Pythagorean Relationship practice (not) (pdf
  • Geometer's Sketchpad Area Relationship (WebSketch) (GSP file)
Did you use this activity? Do you have a way to make it better? If so tell us in the comment section. Thanks